CleanMetrics.io - Presentation Demo
Featured

CleanMetrics.io - Presentation Demo

React Tailwind Node.js

Demo for potential prospect client in the Laundromat software business. Unified analytics, marketing attribution, and customer lifecycle tracking for multi-store laundromat portfolios. From ad click to in-store repeat visit -- see everything.

01

Project Overview

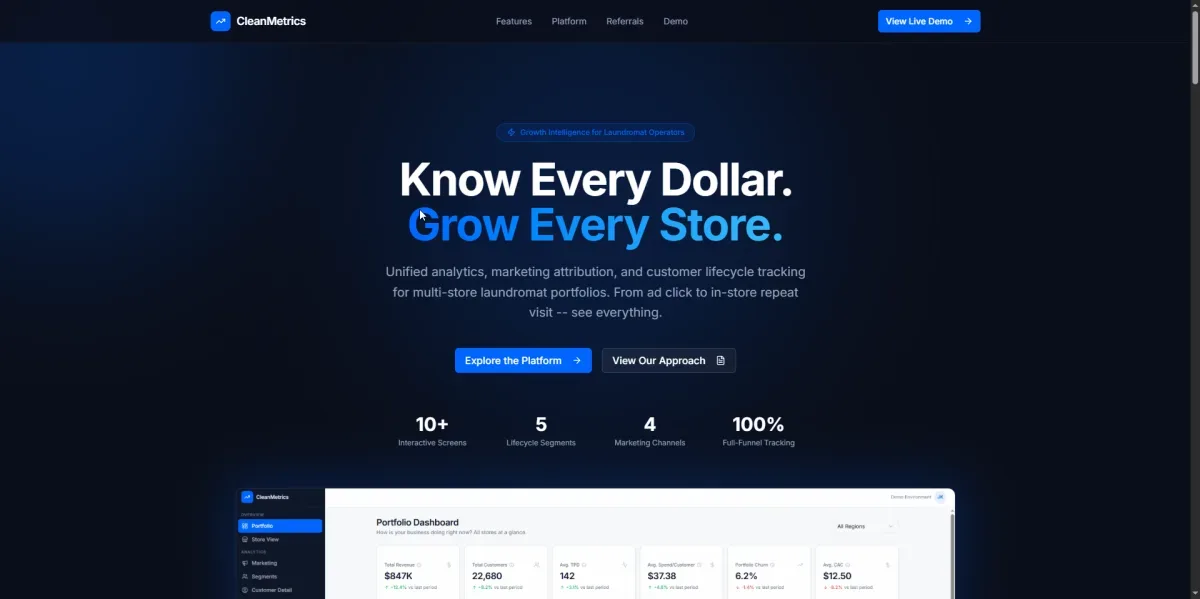
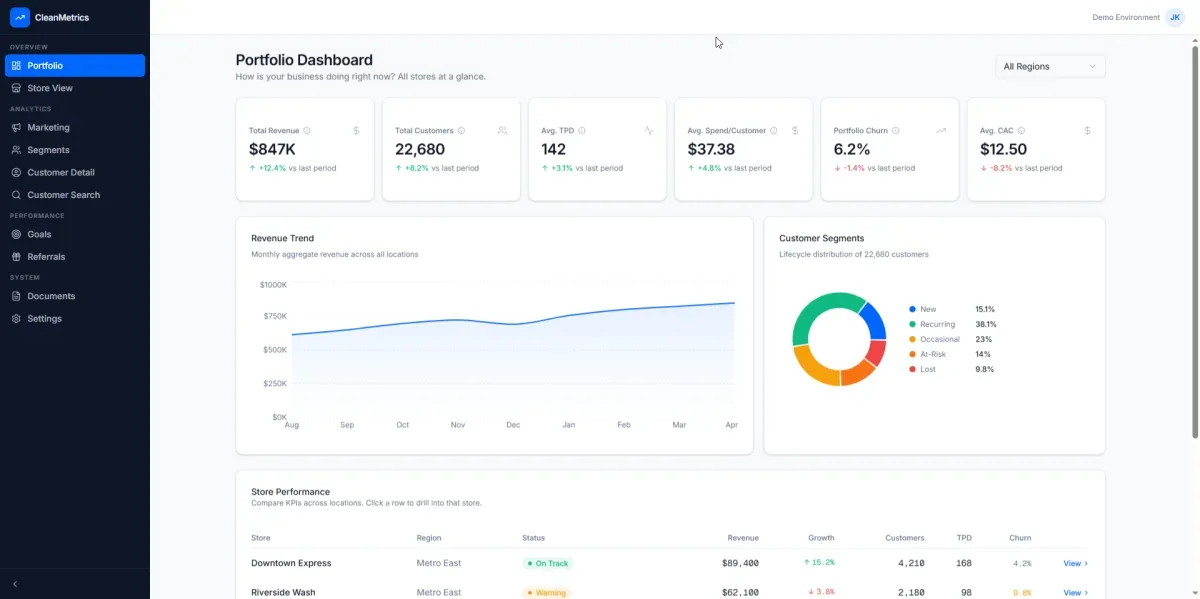
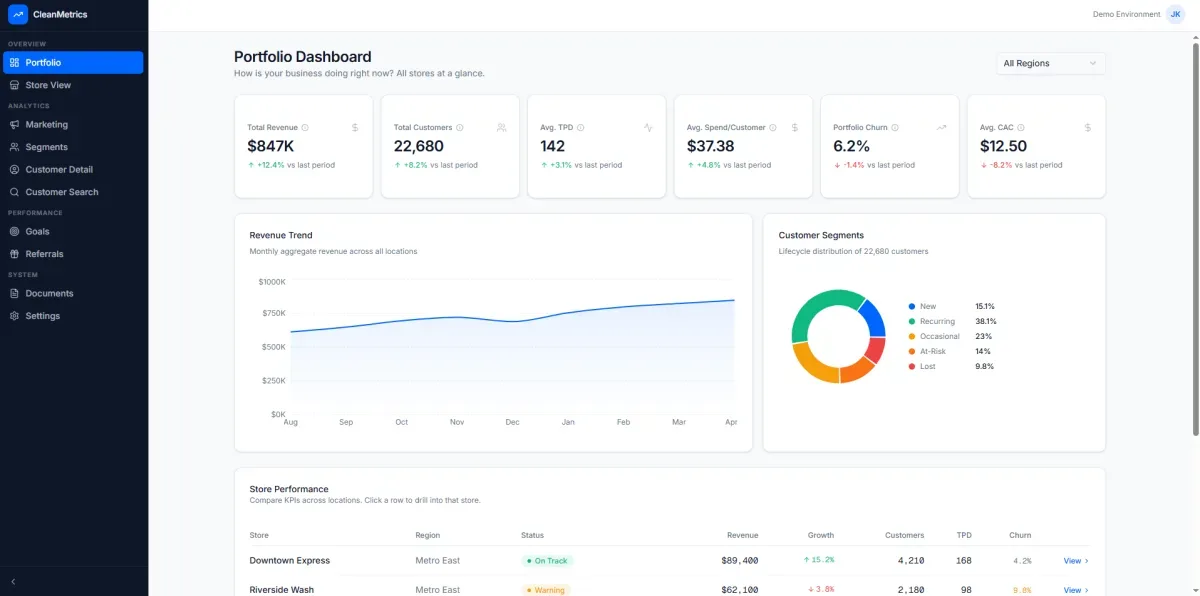
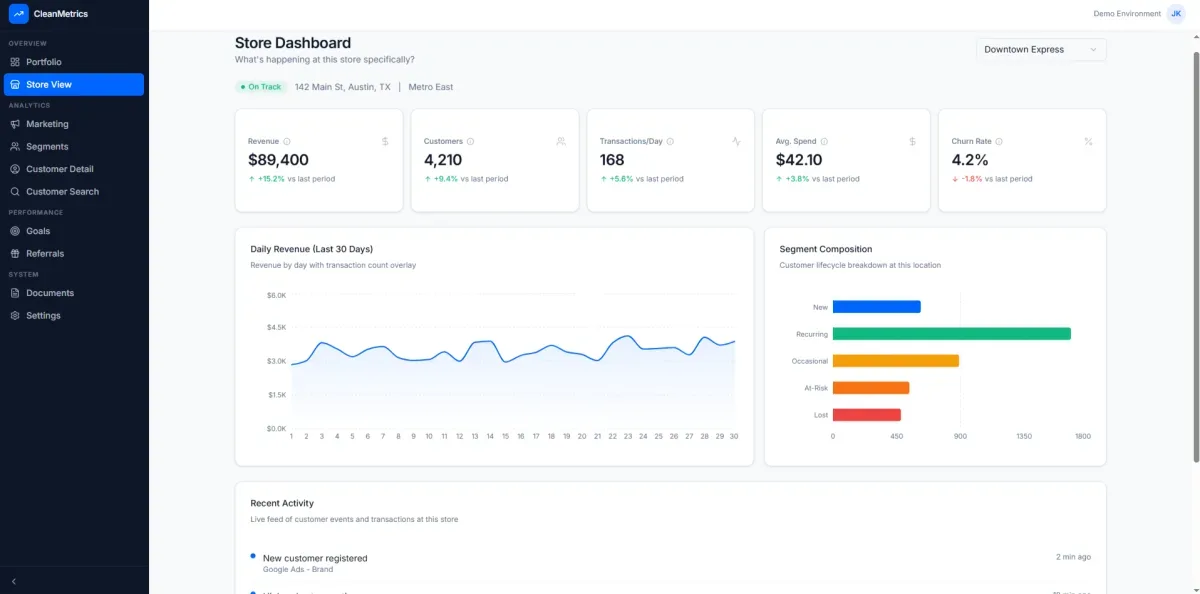
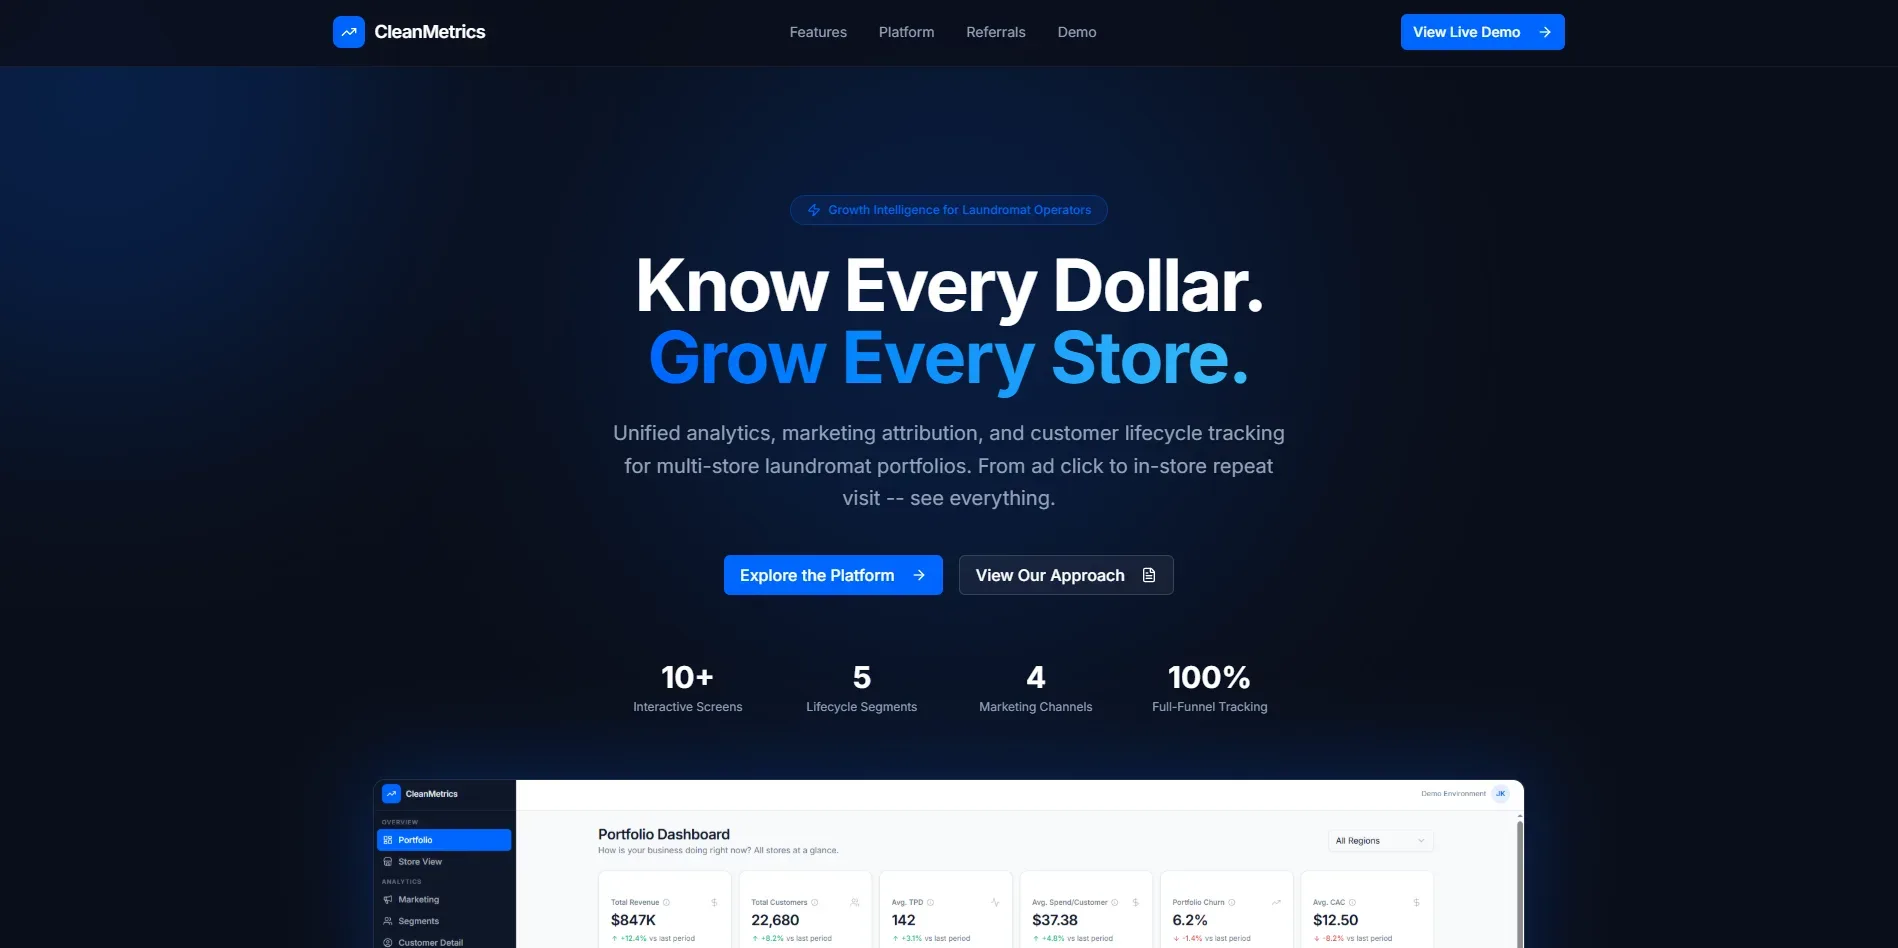
CleanMetrics.io was conceived as a strategic analytics prototype to demonstrate how laundromat operators can finally see everything that matters — from marketing performance to customer retention at both store and portfolio levels.


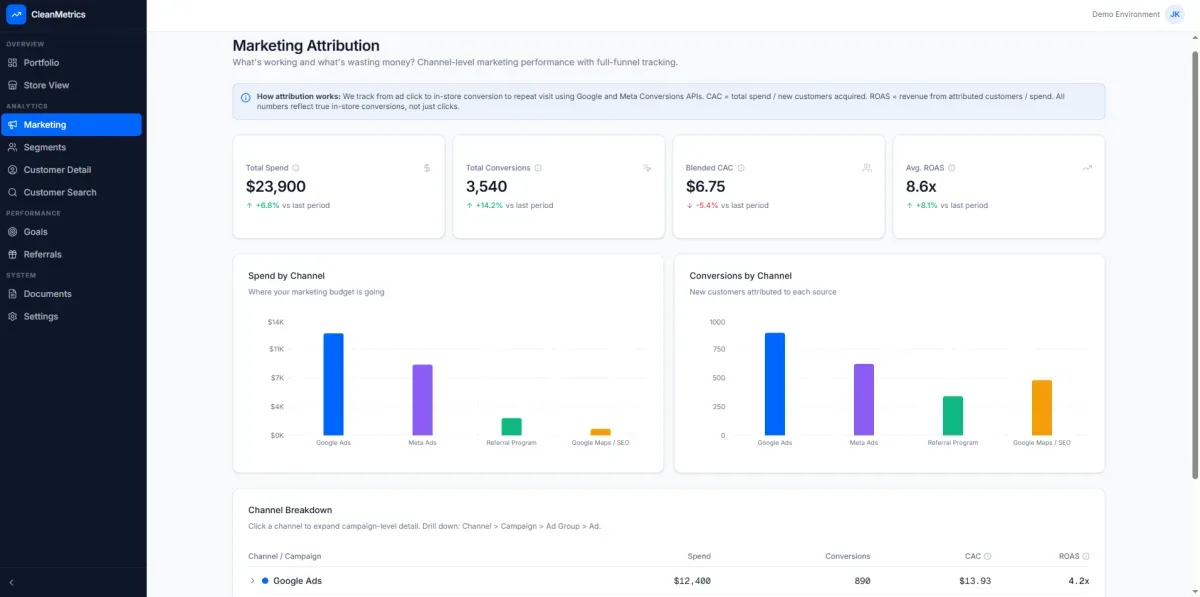
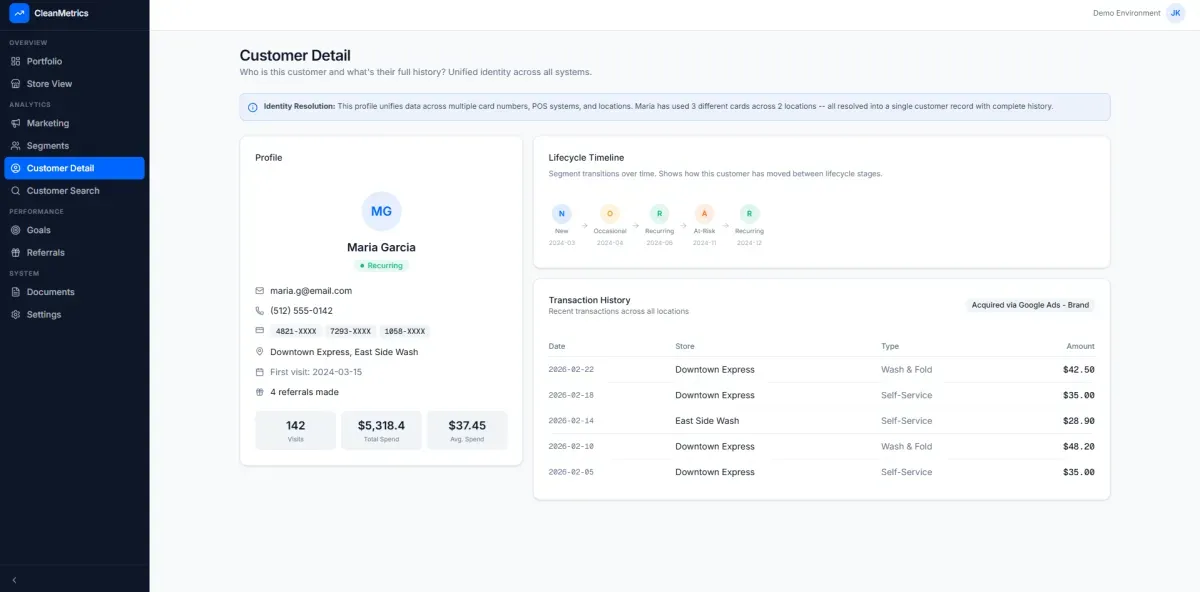
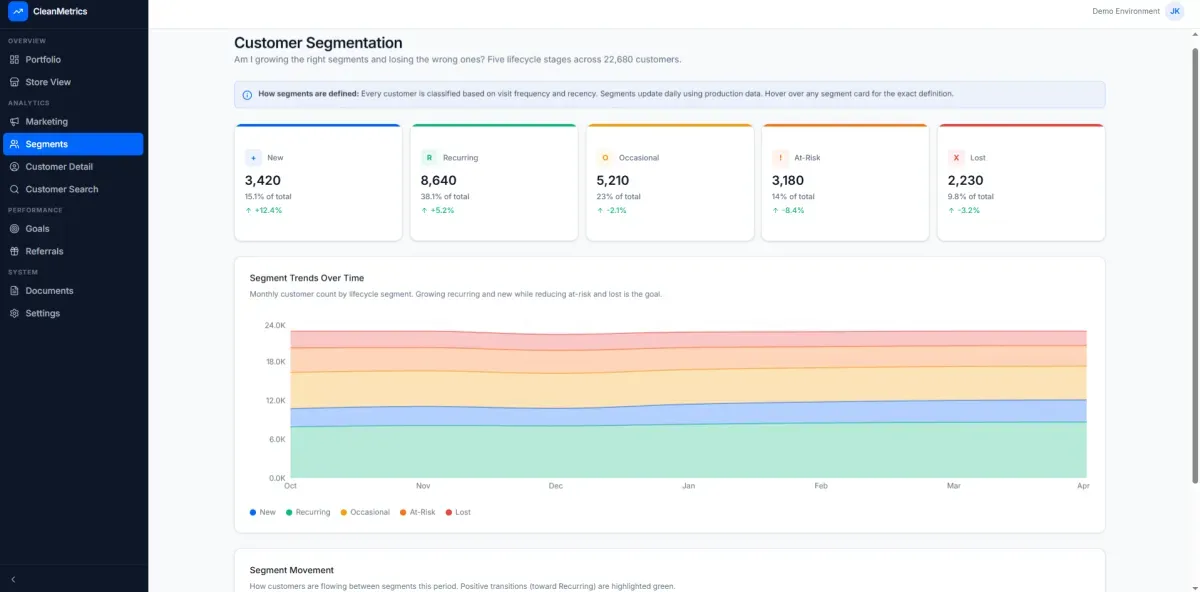
Instead of siloed data — where ad clicks, POS sales, loyalty behavior, and visit patterns live in separate systems — CleanMetrics brings them together. The platform reveals not only what customers did, but how and when they did it: from first touch through repeat visits, average revenue per customer, and long-term lifetime value.


This demo was created to position a next-generation SaaS solution for multi-location laundromat businesses — a space that increasingly demands actionable data intelligence without complexity.

Project Overview
02

My Role

Lead Product Strategist, Architect & Prototype Developer

  • Defined product vision for unified analytics tailored to laundromat portfolios

  • Built data aggregation and attribution logic

  • Designed dashboard layouts and visualizations

  • Implemented core front-end analytics interface

  • Structured lifecycle metric pipelines and customer journey flows

  • Created a compelling demo narrative for potential client engagement

My Role
03

The Problem

Laundromat owners and operators face significant intelligence blind spots:


  • Marketing channels are tracked separately from sales systems

  • Ad performance metrics don’t connect to real customer value

  • Repeat visit patterns and customer retention are hard to quantify

  • Store performance is often evaluated without longitudinal insight

  • Data sits in silos (POS, ad platforms, loyalty platforms, foot traffic counters)

  • No unified view of customer acquisition → retention → revenue


This makes it extremely difficult to answer core business questions like:


  • Which ad campaign actually drove paying repeat customers?

  • How long until a new customer becomes a loyal one?

  • Which locations have better customer lifetime value?

  • Are promotions driving customers who return?


Without a unified analytics platform, decision-makers guess — instead of optimize.

The Problem
04

My Solution

I built CleanMetrics.io as a demo prototype that bridges these gaps by unifying disparate data flows into a coherent, actionable analytics experience tailored for multi-store laundromat portfolios:


  • Defined end-to-end customer journey tracking — from ad click to store visit and repeat action

  • Architected a multi-store data model that allows aggregated and per-location insight

  • Designed marketing attribution logic that ties revenue back to first touch and channel performance

  • Built lifecycle tracking metrics showing repeat visit trends, retention curves, and LTV

  • Created an intuitive dashboard with visualization components showing insights at a glance

  • Delivered contextual filter controls to segment by location, campaign, date range, and customer cohort


The platform was built not as a generic analytics tool, but as an industry-specific intelligence system providing immediate operational value to laundromat owners and operators.

My Solution
My Solution
My Solution
My Solution
05

Customer Intelligence

Unified profiles with identity resolution across card systems and locations. Full lifecycle and transaction history.

Customer Intelligence
06

Portfolio Dashboard

Aggregated KPIs, revenue trends, customer segments, and store performance across all locations at a glance.

Portfolio Dashboard
Store-Level Analytics
07

Store-Level Analytics

Drill into any location. Daily revenue, transaction trends, segment composition, and a live activity feed.

08

Marketing Attribution

Full-funnel tracking from ad click to in-store repeat visit. True CAC, ROAS, and channel-level drill-down.

Marketing Attribution
Customer Segmentation
09

Customer Segmentation

Five lifecycle stages -- New, Recurring, Occasional, At-Risk, Lost -- with trends and movement tracking.

10

Achievement Metrics

  • Unified disparate data sources into a coherent journey view

  • Showcased true attribution for marketing spend across channels

  • Visualized customer retention and repeat visit patterns over time

  • Delivered dashboard analytics for both aggregated portfolio level and single store insight

  • Demonstrated actionable KPIs like lifetime value (LTV), churn rate, and conversion back to spend

  • Enabled operators to see which marketing dollars actually translate into repeat revenue

This demo transformed what had been disconnected metrics into a single source of truth — helping business leaders see beyond vanity metrics toward real operational impact.

Jump to Project